What are the Process improvement Tools?
We face problems in our day to day life.In industry environment it is very important that all the process should run as per plan.An efficient process even have scope for improvement.Followings are the 7 process improvement tools which are used to solve the problem.These tools are also sometimes called as 7 QC tools for process improvement.Other than these basis QC tools there are management tools also which are used to solve complex problems.
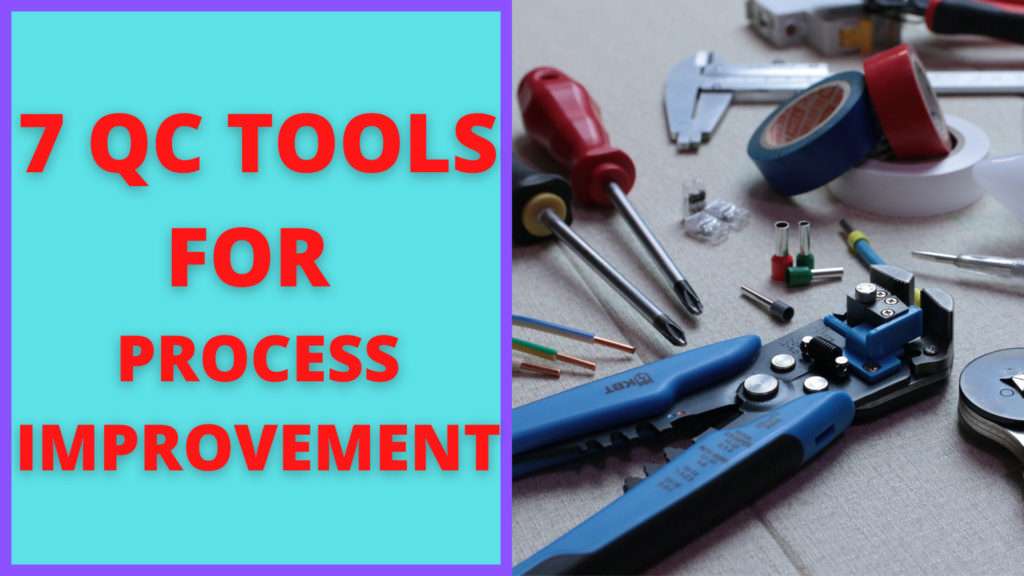
What are the 7 QC tool list ?
- Flow Chart
- Check Sheet
- Cause and Effect Diagram
- Pareto Chart
- Control Chart
- Histogram
- Scatter Diagram
1. Flow Chart
Flow chart shows the sequence of steps and the decision points like “yes/No” or “Go/No Go”.For solving any problem it is the starting point to know the present condition of the process. Starting with Flow chart can reveal any short coming in the process like missing steps,redundant or abnormal steps in process design.For a larger process a deployment Flowchart or Swim-lane chart may be used where the process involve multiple departments like Customer service, Marketing ,Production, Materials Management or Purchasing etc.
Quality is Built in Not Inspected
2. Check Sheet
Check sheets are used to gather information on data and its frequency of occurrence. Check sheets are also called as tally sheet. The data gathered from check sheets are used for analysis and decisions. It helps to use the fact rather than the opinions of the problem solving team. It some times used to know the clusters area where the most defects are occurring. The problem in casting can be analyze by knowing that what is problematic area in the casting e.g. casting defects and factor contributing defects to that area. This types of sheets are called as measles chart or defect fact sheet.
3. Cause and Effects Diagram
Cause and Effect Diagram is also Called as Ishikawa Diagram or Fishbone diagram.The inventor of the Cause and Effect Diagram is Kaoru Ishikawa.The CE Diagram provides the long list of potential reasons that may be causing the problem in the process.In this the effect is written in the right side whereas the potential causes are mentioned under major categories that may lead to the effect in the process.For the problem related to the manufacturing the problems are categories in four “M” i.e. manpower, machinery, method and material in addition to that two more categories Environment and measurement are also used during problem identification.For sservice related process the categories used are four “P” i.e. People,Policies, procedures, and plant.
4. Pareto Chart
Vilfredo Pareto is the inventor of the 80:20 rule.He observed that the 80 percent of wealth is in 20 percent of people.By this analogy quality guru Juran stated that 80 percent of variations are caused by 20 percent of variables.
5. Control Chart
Control chart defines the variations in the process with respect to upper and lower control limits.Contol chart is the upgradation of the run chart with addition of control limits.Control chart shows whether the process is in control or out of control.The out of control process is influenced by special causes. Control chart also indicates how the process is behaving over time.Control chart is very important tool for diagnosis of potential causes it shows the pattern of variations.The variation in the pattern can be sudden process jump,shift in the proces ,gradual trend or increased variation.In case of if pattern is showing decrease in the variation it shows the process is improving.
6. Histogram
Frequency distribution of the data is measured by Histogram.
7. Scatter Diagram
Whether the correlation exist between two variables.It is plotted on X-Y graph.Scatter diagram show pairs of numerical data of variables with one variable on each axis.The scatter diagram shows the relationship between the two variables.Example of scatter diagram could be the relation ship between the adhesive strength and the curing temperature where the strength increases with increase in the heat.


 in Hindi")


[…] Also read: What are Process Improvement 7 QC Tool | What is 7 QC tool in Quality ? […]